Email deliverability center
The Email deliverability center gives you full visibility into your email sending performance, sender reputation, and domain and IP health, all in one place. Use it to monitor delivery trends, identify issues before they impact your campaigns, and take corrective action directly from the dashboard.
To access the Email deliverability center:
- Log in (opens in a new tab) to your Infobip account.
- Go to Analyze → Email deliverability center.
The center is organized into four sections:
- Overview: High-level summary of deliverability health with key metrics and trend charts, broken down by sender, domain, IP, provider, error code, and campaign.
- Performance analytics: Deep-dive view for slicing data across any combination of dimensions and time periods. Group and filter data. Your filters and metrics are automatically saved between sessions.
- IP reputation: Sending IP reputation across Google Postmaster Tools, Microsoft, Sender Score, blocklist monitoring, and spam trap tracking.
- Domain reputation: Monitor sender domain reputation, blocklist status, and spam trap hits. Verify SPF, DKIM, and DMARC authentication records.
The center also includes the Deliverability agent. This AI-powered chat assistant answers deliverability questions, diagnoses issues, and provides recommendations based on your actual sending data.
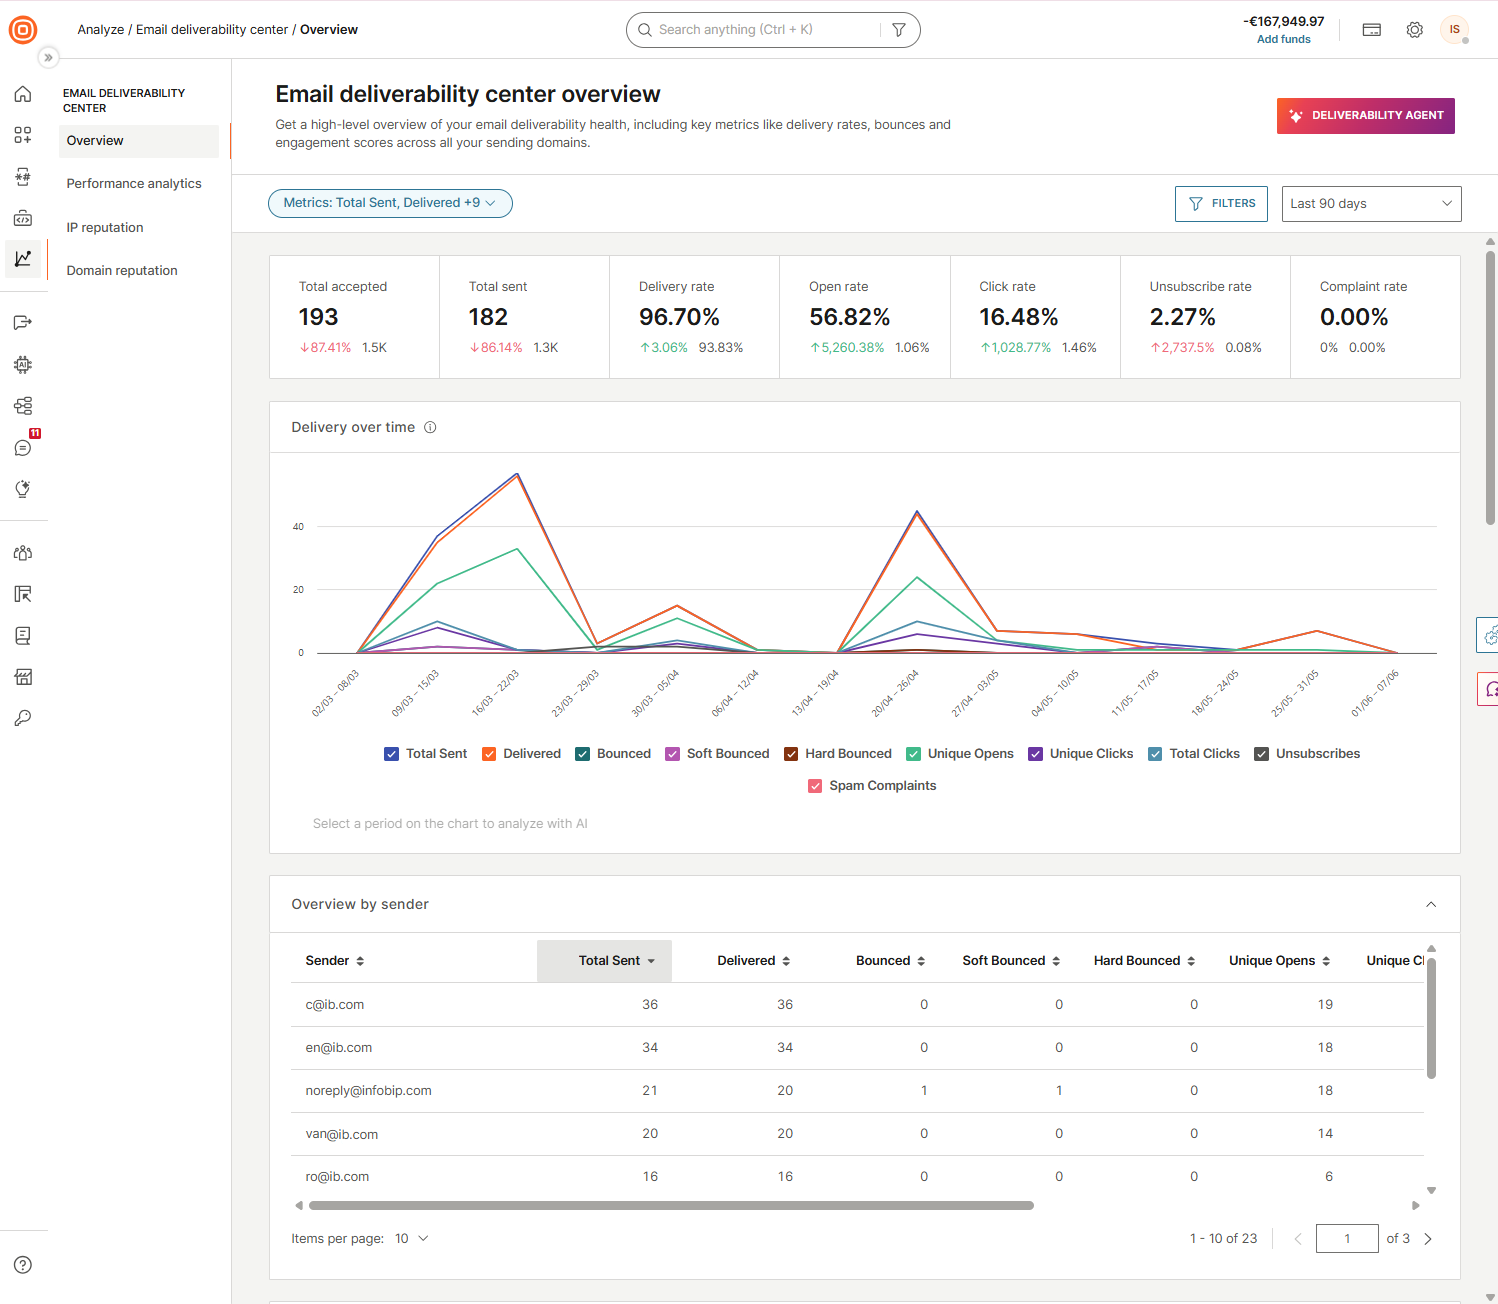
Overview
The Overview page provides a high-level summary of your email deliverability health. Key metrics include delivery rates, bounces, and engagement scores across all your sending domains.
Use the Metrics control on the top left and the Filters and time period controls on the top right to customize the data shown.
Metrics
Select Metrics to choose which metrics are displayed. You can select up to all available metrics and select Apply metrics to apply your selection.
The following metrics are available:
- Total sent
- Total accepted
- Delivered
- Delivery rate
- Bounced
- Bounce rate
- Soft bounced
- Soft bounce rate
- Hard bounced
- Hard bounce rate
- Dropped
- Dropped rate
- Suppressed
- Unique opens
- Unique open rate
- Total opens
- Open rate
- Machine opens
- Machine open rate
- Unique clicks
- Unique click through rate
- Total clicks
- Click rate
- Click to open rate
- Unsubscribes
- Unsubscribe rate
- Spam complaints
- Spam rate
- Retried
- Pending
Filters
Select Filters → Add new filter to narrow the data by one or more of the following dimensions:
- Sender
- Sender domain
- Recipient domain
- Sending IP
- Envelope domain
- Email provider
- Status group
- Status
- Error code
- Application ID
- Entity ID
- Campaign
Time period
Select the time period control to set the date and time range for the data. You can choose a predefined period or set a custom range with a specific start date, start time, end date, and end time.
The following predefined periods are available:
- Last 6 hours
- Last 24 hours
- Last 7 days
- This week
- Last week
- This month
- Last month
- Last 30 days
- Last 90 days
Summary metrics
The top of the page shows the following metrics for the selected time period:
| Metric | Description |
|---|---|
| Total accepted | Total number of emails accepted for delivery. |
| Total sent | Total number of emails sent. |
| Delivery rate | Percentage of sent emails successfully delivered to recipients. |
| Open rate | Percentage of delivered emails opened by recipients. |
| Click rate | Percentage of delivered emails where a link was selected. |
| Unsubscribe rate | Percentage of delivered emails that resulted in an unsubscribe. |
| Complaint rate | Percentage of delivered emails reported as spam by recipients. |
Delivery over time
The Delivery over time chart shows trends for the selected metrics over the selected time period. Each selected metric appears as a separate line in the chart, color-coded to match the legend shown below the chart.
To analyze a specific period with the AI assistant, drag on the chart to select a time range.
Breakdown tables
Below the chart, the same metrics are broken down in separate tables. Each table shows the dimension column plus all metrics selected in the Metrics panel.
Select any column header to sort by that metric. Scroll horizontally to see all metrics when many are selected.
| Table | Dimension column | Description |
|---|---|---|
| Overview by sender | Sender | The sender address used to send the emails. |
| Overview by sender domain | Sender domain | The domain of the sender address. |
| Overview by envelope domain | Envelope domain | The domain used in the envelope (Return-Path) of the email. |
| Overview by sending IP | Sending IP | The IP address used to send the emails. |
| Overview by recipient domain | Recipient domain | The domain of the recipient email address. |
| Overview by email provider | Email provider | The email service provider of the recipient (for example, Google Gmail). |
| Overview by error code | Error code | The error code returned for the message (for example, NO_ERROR). |
| Overview by campaign | Campaign | The campaign associated with the sent emails. |
Understand email deliverability
Core concepts behind deliverability, reputation, authentication, and inbox placement.
Deliverability services
Professional services available to help improve your sending reputation and inbox placement.
IP and domain warmup
Best practices for warming up new IPs and domains before full-volume sending.