Voice dashboard
The Voice and Video dashboard offers a detailed overview of your call traffic, including delivery performance, call outcomes, and engagement trends. This dashboard is part of the new Analyze experience and enables you to monitor metrics like attempted and answered calls, call duration, and answer rates.
To ensure data accuracy and consistency, the new dashboard will only display aggregated Voice and Video data from May 15, 2025 onwards. Historical data before this date is not available.
General overview
The General overview page highlights key indicators to help you discover how your channel is performing:
- Total calls: The total number of calls sent to your customers (outbound) and voice calls received from your customers (inbound).
- Total answered calls: The number of calls that were successfully answered, whether inbound or outbound.
- Call duration (sec): The total duration of all answered calls, measured in seconds.
- Average call duration (sec): The average length of answered calls, measured in seconds.
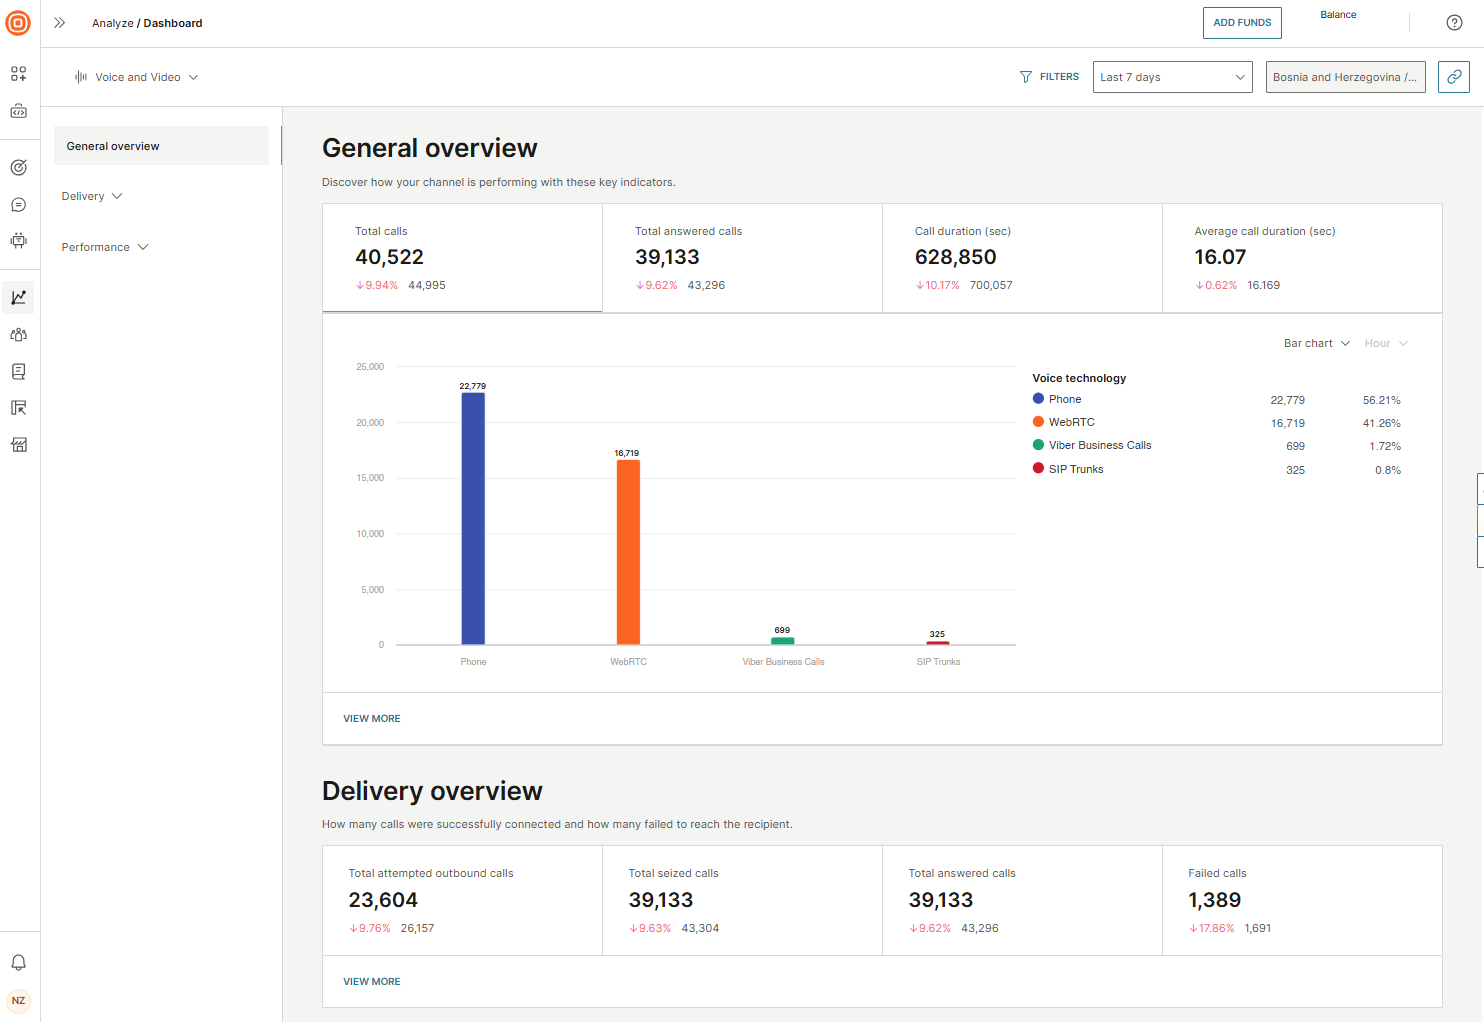
Delivery
The Delivery section provides insight into how your calls are connecting with recipients. It includes key metrics that help you evaluate call attempts, successful connections, and delivery issues across both inbound and outbound traffic.
Key indicators
- Total calls: The total number of calls sent to your customers (outbound) and voice calls received from your customers (inbound).
- Total attempted outbound calls: The number of calls your business attempted to initiate.
- Total seized calls: Total number of calls that have successfully reached the recipient's device and started ringing, regardless of whether they were ultimately answered or not.
- Total answered calls: The number of calls that were successfully answered, whether inbound or outbound.
- Failed calls: The number of calls that were not successfully delivered due to issues such as rejection by the recipient or operator, or recipient unavailability.
Detailed indicators
- Total received calls: The number of voice calls received from customers.
- Not answered: The number of outbound calls that were not answered by the recipient.
- Busy: The number of outbound calls that failed due to the recipient's line being busy.
- Canceled: The number of outbound calls that were canceled before they could be routed to the recipient.
Performance
The Performance section helps you analyze how recipients are interacting with your calls. It includes metrics that reflect user behavior, call outcomes, and engagement trends such as call durations, pickup efficiency, and termination reasons.
Key indicators
- Average call duration (sec): The average length of answered calls, measured in seconds.
- Average ringing time (sec): The average time from when the call starts ringing to when it is answered or terminated.
- Average time to answer (sec): The average time it takes for recipients to answer calls.
- Call hang-ups: The total number of call terminations, including those ended by users or due to system issues.
- Answer seizure ratio: The percentage of seized calls (calls that rang) that were successfully answered.
- Answer rate: The percentage of attempted calls that were successfully answered.
Detailed indicators
- Busy rate: The percentage of attempted calls that failed due to the recipient’s line being busy.
- Normal hang-up: The number of calls ended by users after a successful interaction.
- Hang-up due to an error: The number of calls terminated due to a system-related error.
- Call duration: The total time of all answered calls, measured in seconds.
Supporting data
The Supporting data section for Voice and Video provides additional data for your Voice and Video traffic across countries and networks. Use this data to identify regional trends, performance bottlenecks, or infrastructure issues that may affect call quality and delivery.
Depending on the selected metrics, you can see further data based on:
- Country: A geographic breakdown of call performance, helping you compare delivery rates, engagement, and failures across different regions.
- Network: A breakdown by recipient network provider, allowing you to detect call quality issues or connection problems tied to specific operators.
- Time to answer: Segments call data based on how quickly recipients answer, giving insight into responsiveness and potential latency across regions or networks.
For more detailed information on the types of available metrics, refer to the Metrics API documentation. However, as the Analyze dashboard is still evolving, it might not contain every enriched metric available on the dashboard.