Email dashboard [#email-dashboard-dashboard-configuration]
The Email dashboard provides a comprehensive view of your email communication performance. It offers detailed metrics and insights to help you understand how your emails are performing, including key indicators such as delivery, engagement, and audience behavior.
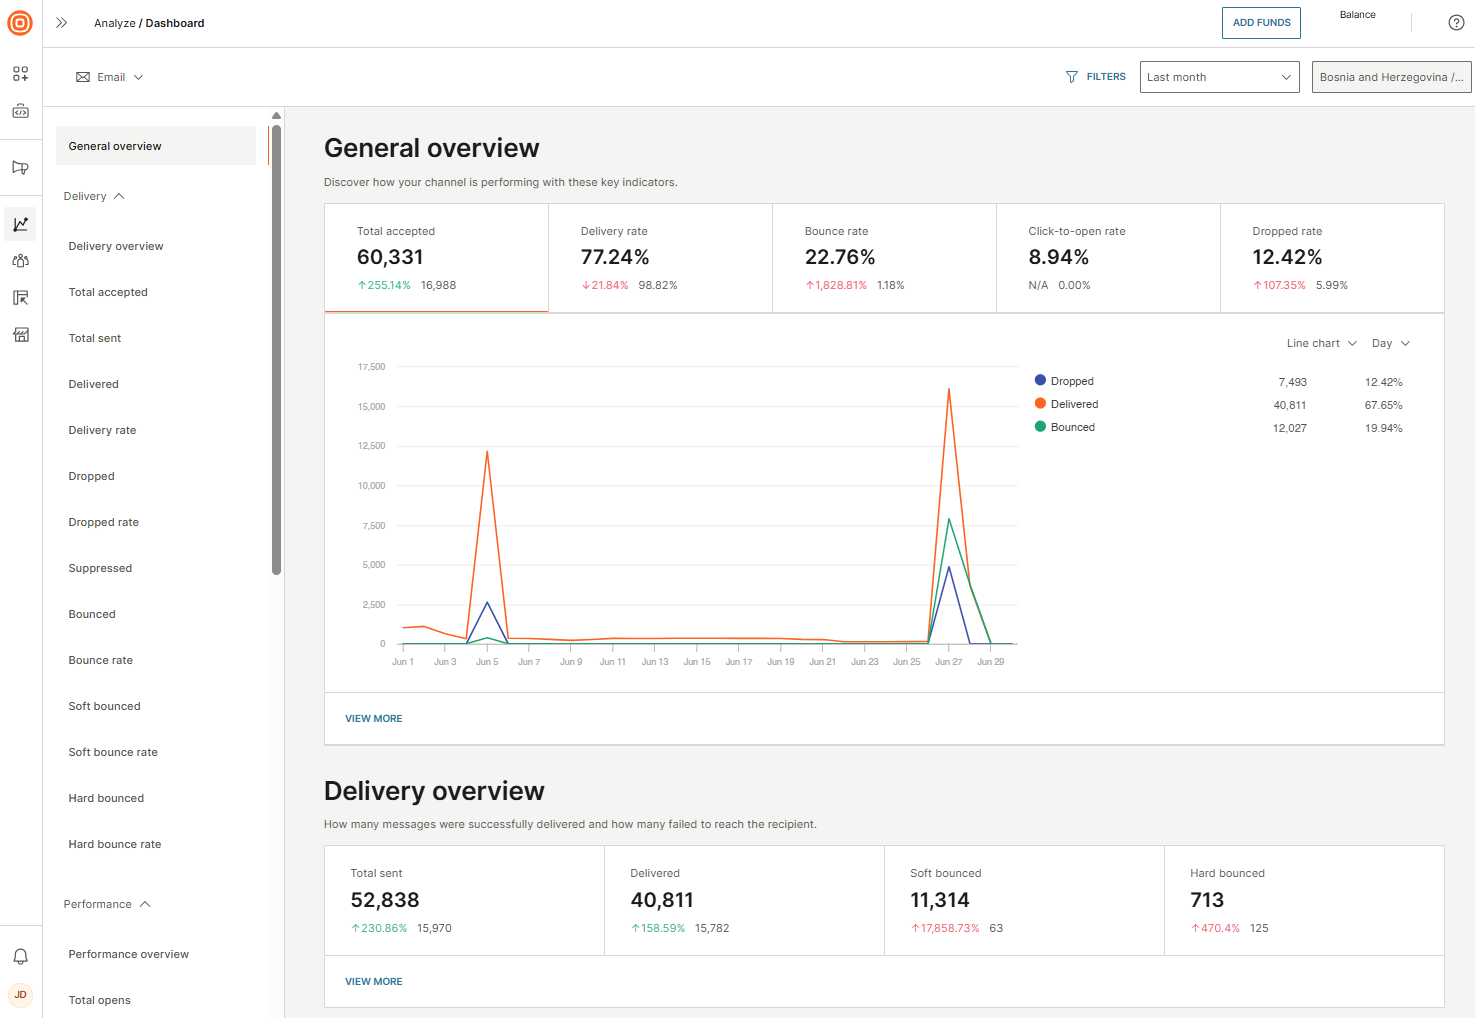
General overview
The General overview page highlights key indicators to help you understand the overall performance of your email communications:
- Total accepted: The total number of emails that the email servers have accepted for delivery. Calculated by combining dropped, delivered, bounced, retried, and pending emails.
- Delivery rate: The percentage of accepted emails that were successfully delivered to recipient inboxes.
- Bounce rate: The percentage of emails that could not be delivered and were returned by the mail server. This includes both hard and soft bounces.
- Click-to-open rate: The percentage of recipients who clicked on a link within the email, relative to the number of recipients who opened the email.
- Dropped rate: The percentage of emails that were not delivered due to issues like invalid email addresses or being flagged as spam.
Delivery
The Delivery page provides a breakdown of the different delivery outcomes for your emails.
Key indicators
- Total sent: The total number of emails sent from our platform to the mailbox provider. Calculated by combining delivered, bounced, and retried emails.
- Delivered: The number of successfully delivered emails.
- Soft bounced: The number of emails that could not be delivered due to temporary issues, such as a full inbox.
- Hard bounced: The number of emails that could not be delivered due to permanent issues, such as invalid email addresses.
Detailed indicators
- Total accepted: The total number of emails accepted by email servers for delivery. Calculated by combining dropped, delivered, bounced, retried, and pending emails.
- Delivery rate: The percentage of accepted emails that were successfully delivered to recipient inboxes.
- Dropped: The number of emails that were not delivered due to issues such as bounced addresses or sender errors. Calculated by subtracting delivered, bounced, retried, and pending emails from the total traffic.
- Dropped rate: The percentage of emails that were dropped and not delivered.
- Suppressed: The number of emails that were blocked from sending based on previous user behavior or preferences.
- Bounced: The total number of emails that could not be delivered due to issues such as invalid addresses, including soft and hard bounces.
- Bounced rate: The percentage of emails that bounced, relative to the total number of sent emails.
- Soft bounced rate: The percentage of emails that soft bounced, relative to the total number of sent emails.
- Hard bounced rate: The percentage of emails that hard bounced, relative to the total number of sent emails.
Performance
The Performance page provides insights into how your emails are engaging with recipients by tracking key user actions. These metrics help you evaluate the effectiveness of your email campaigns and identify areas for improvement.
Key indicators
- Total opens: The total number of times recipients opened your emails.
- Total clicks: The total number of clicks on links within your emails (Unsubscribe link is not counted).
- Unsubscribes: The number of recipients who opted out of receiving future emails.
- Spam complaints: The number of emails your recipients reported as spam.
Detailed indicators
- Open rate: The percentage of recipients who opened the email.
- Click rate: The percentage of recipients who clicked on a link within the email.
- Click-to-open rate: The percentage of recipients who clicked on a link within an email, relative to the number of unique opens (each recipient is counted only once).
- Unsubscribe rate: The percentage of recipients who unsubscribed from your emails.
- Spam complaints rate: The percentage of emails reported as spam by recipients.
Audience
The Audience page provides insights into how recipients interact with your emails across different devices and locations, helping you better understand audience behavior.
Key indicators
- Total opens by device: The total number of times your emails were opened, based on the device used.
- Total clicks by device: The total number of clicks on links within your emails, based on the device used.
- Total opens by geolocation: The total number of email opens, based on the geographic location of the recipients.
- Total clicks by geolocation: The total number of clicks on links within your emails, based on the geographic location of the recipients.
Detailed indicators
- Unique clicks: The number of unique recipients who clicked on a link within your emails (each recipient is counted only once).
- Unique opens: The number of unique messages your recipients opened (each recipient is counted only once).
Supporting data
The Supporting data section for Email provides additional metrics to help you assess how well your emails are performing.
Depending on the selected metrics, you can see further data based on:
- Communication: A breakdown of metrics by the type of communication..
- Sender domain: Additional insights into how your emails perform based on the sender domain.
- Errors by sender domains: Analyze the number of email delivery errors, categorized by sender domain.
- Open rate and click rate: The percentage of delivered emails your recipients opened or where recipients clicked on a link within the mail.
- Unsubscribe rate per sender domain: See the rate at which recipients unsubscribe.
- Spam complaints rate per sender domain: Track the percentage of emails reported as spam, categorized by sender domain.
- Application: Get insights into how your email performance varies across different applications. Track delivery, engagements, and errors to better optimize your campaigns.
- Entity: See the performance of your emails associated with specific entities. Analyze delivery rates, engagement, and errors and get granular insights for better decision-making.
For more detailed information on the types of available metrics, refer to the Metrics API documentation. However, as the Analyze dashboard is still evolving, it might not contain every enriched metric available on the dashboard.
Refer to the video below for more details.