Performance report
EARLY ACCESS
Use the power of AI to analyze your chatbot and get insights into its performance. The AI engine does the following:
- Analyzes your chatbot’s performance and provides metrics.
- Provides actionable insights into what is working and what is not.
- Provides suggestions to improve the chatbot.
- Identifies issues and provides suggestions to resolve these issues.
- Shows the most common paths taken by your end users.
Create a report [#create-report]
You can create a report only for chatbots that have at least one active session with end users.
You can create a maximum of 10 reports in a day.
You can create the report in one of the following ways:
- From the Performance report section.
- From the Chatbots page.
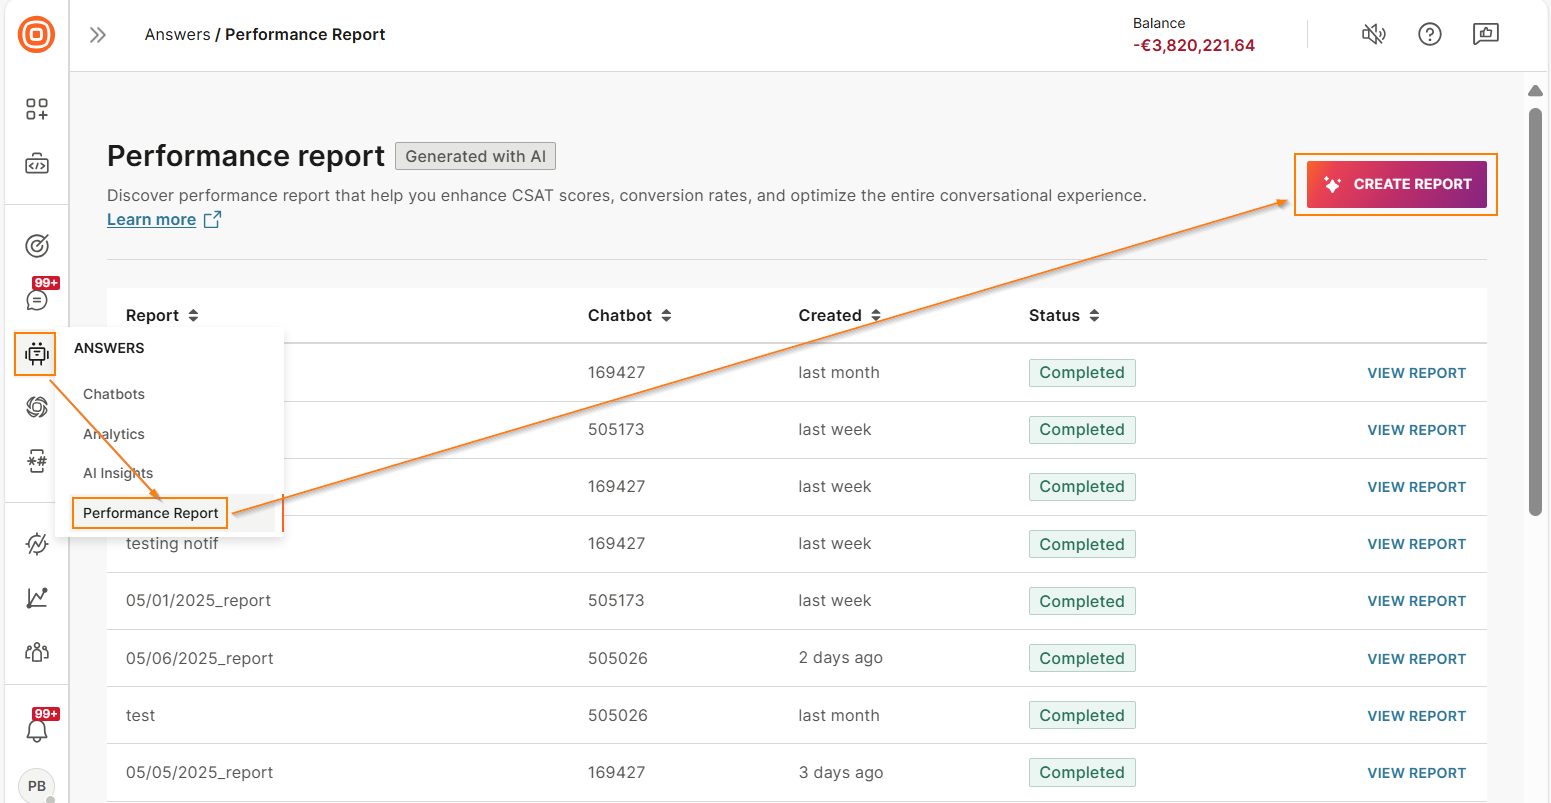
Create from Performance report section [#create-report-performance-report-page]
-
On the Infobip web interface, go to Answers > Performance report.
-
Select Create report.
-
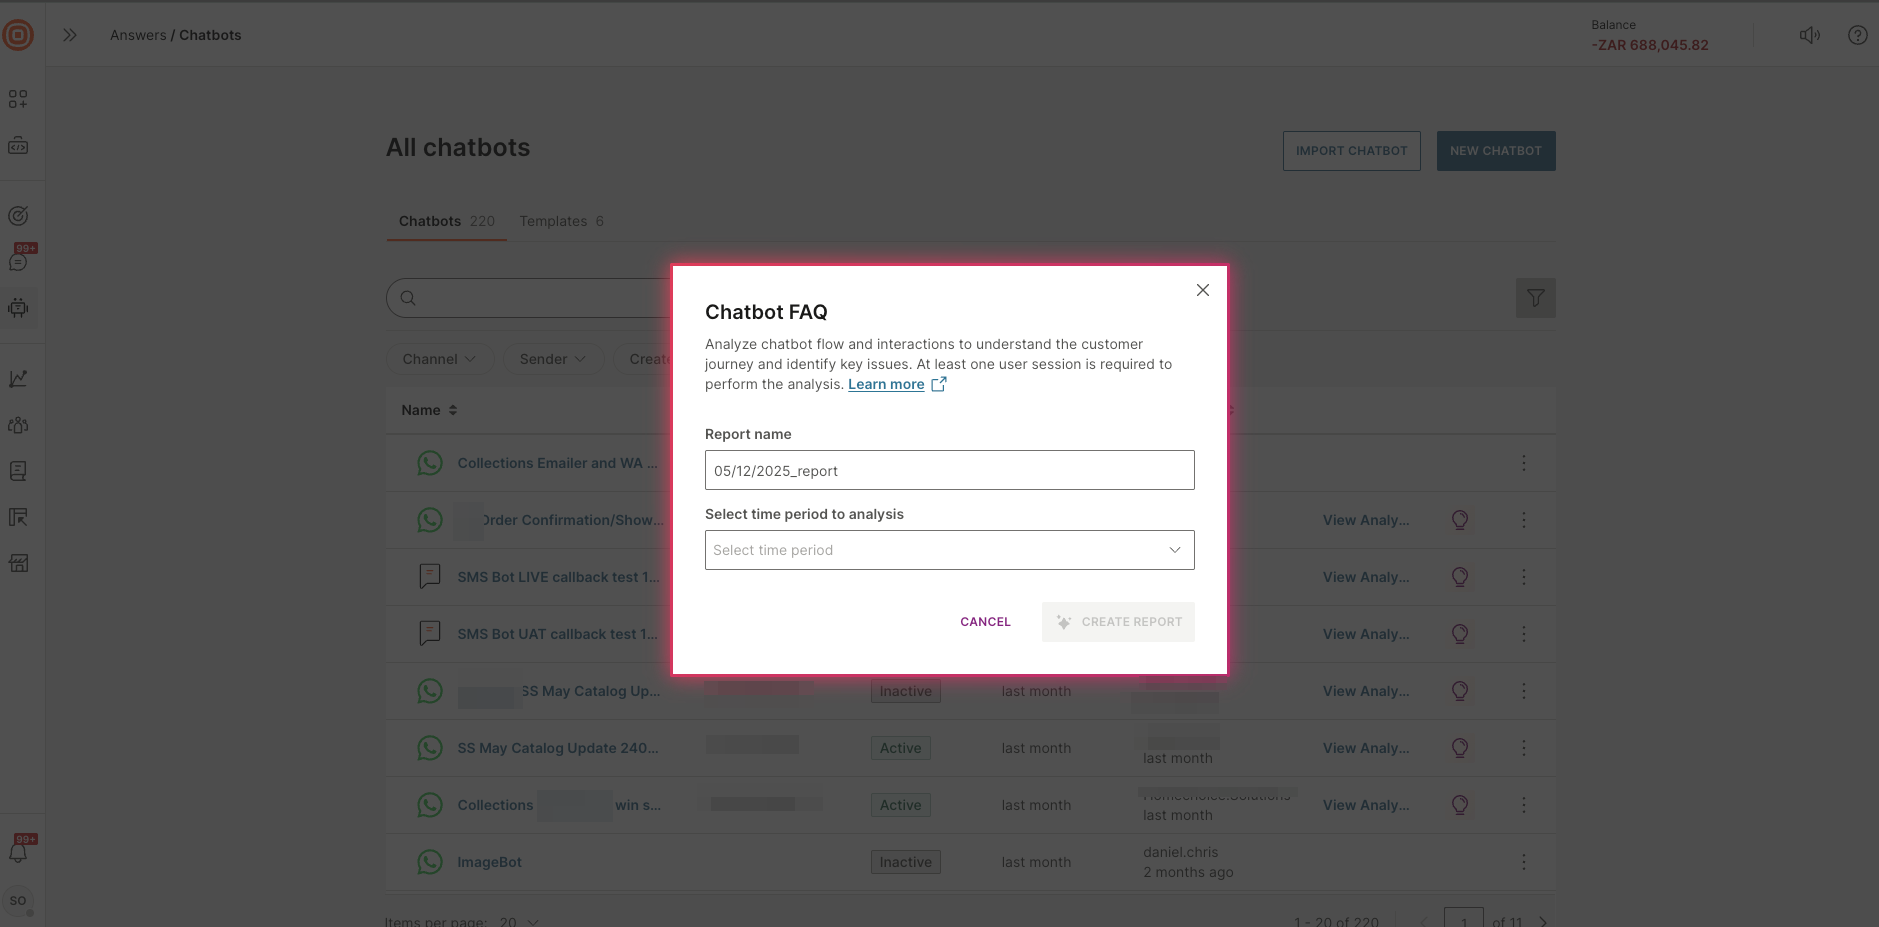
In the Analyze chatbot performance screen, select the period for which you want the report.
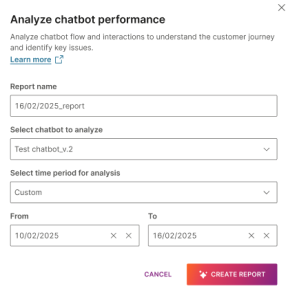
-
Select Create report.
Create the report from the Chatbots page [#create-report-chatbots-page]
-
On the Chatbots page, select the Analyze chatbot performance icon next to the chatbot for which you want the report.
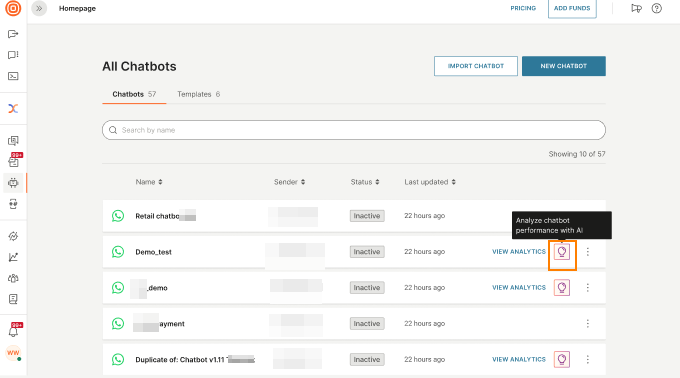
-
In the Analyze chatbot performance screen, select the period for which you want the report.
-
Select Create report.
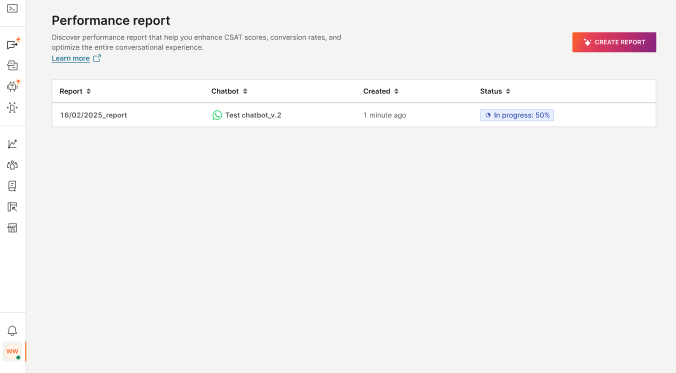
View report creation status [#view-report-creation-status]
You can view the status of the report creation in the Performance report section.
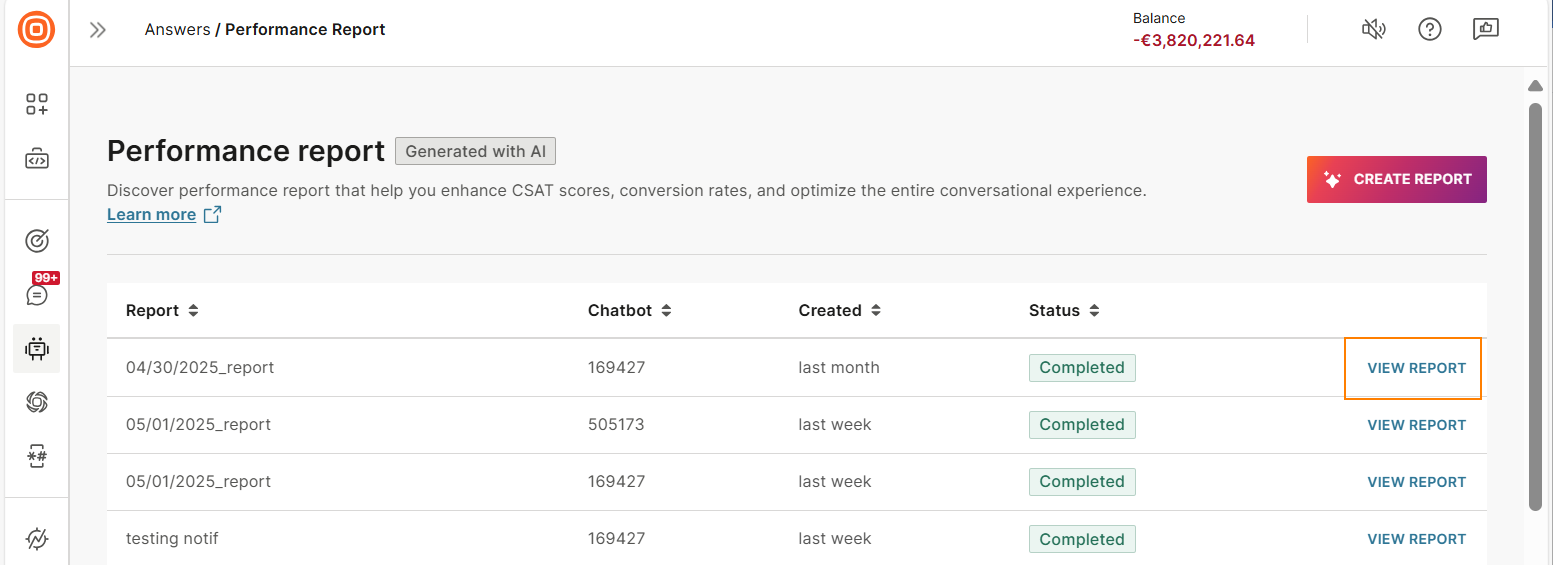
View the report [#view-report]
When the report is ready, select View report to see the analysis.
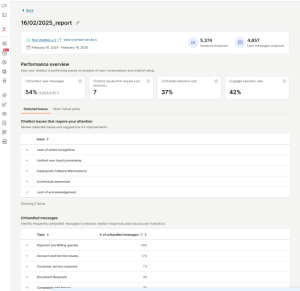
The following image shows an example of the report. For more information, refer to the Content of the report section.
Content of the report [#report-content]
The report contains the following information.
View chatbot details [#report-content-chatbot-details]
To see the details about the chatbot, select View chatbot details.
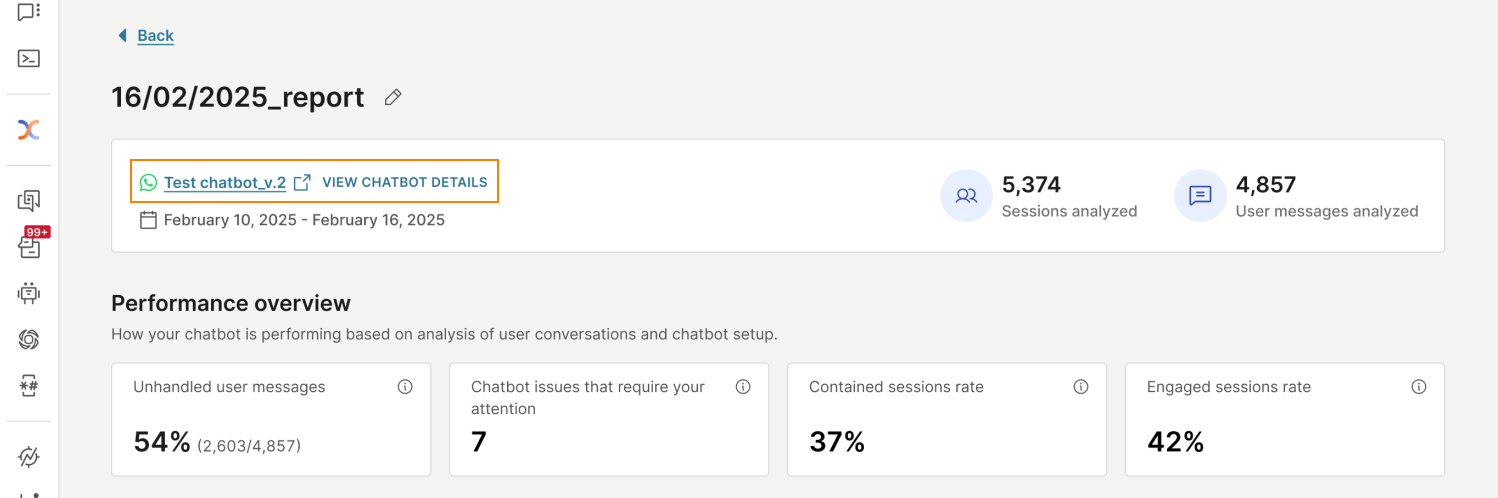
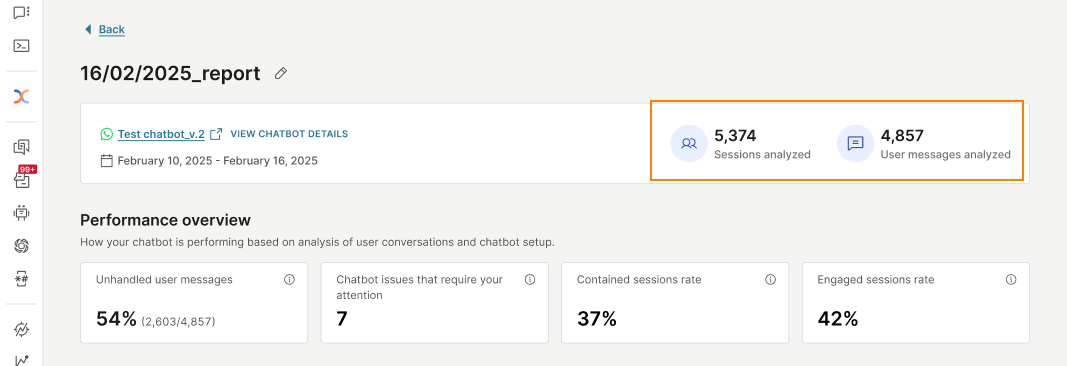
Scope of the report [#report-content-scope]
You can see the number of sessions and user messages that the AI engine analyzed to generate the report for the specified period.
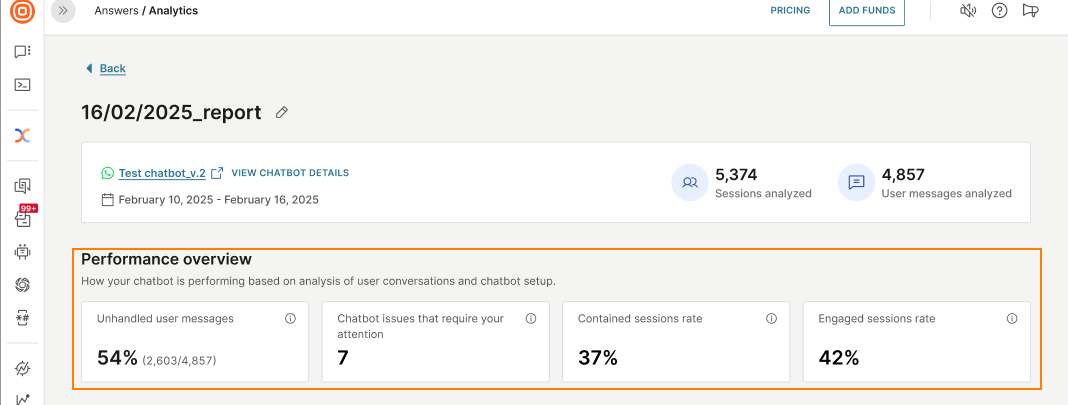
Performance overview [#report-content-performance-overview]
View a summary of the report. You can view the following metrics:
-
Unhandled user messages: These are the end users' messages to which the chatbot did not respond or the end users' inputs that the chatbot did not recognize. You can view the details in the Detected issues > Unhandled messages section.
-
Chatbot issues that require your attention: The report shows the issues that the AI engine detected in the chatbot design. You can view the details in the Detected issues > Chatbot issues that require your attention section.
-
Contained sessions rate: Percentage of chatbot sessions that were completed without escalating to a human agent.
This information is displayed only for chatbots that have a Go to agent element.
-
Engaged sessions rate: The percentage of engaged sessions compared to the total number of chatbot sessions.
An engaged session is one in which an end user initiated the session and then sent a minimum of 1 message to the chatbot.
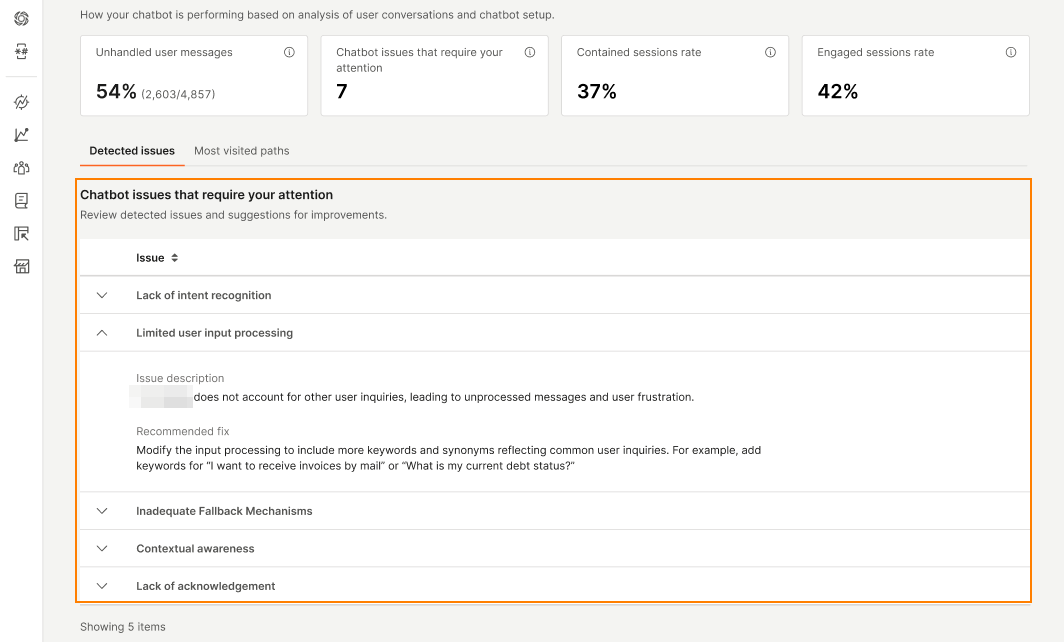
Chatbot issues that require your attention [#report-content-issues-needing-attention]
Go to the Detected issues > Chatbot issues that require your attention section.
The report shows the issues that the AI engine detected in the chatbot design.
You can see a list of issues and recommended solutions.
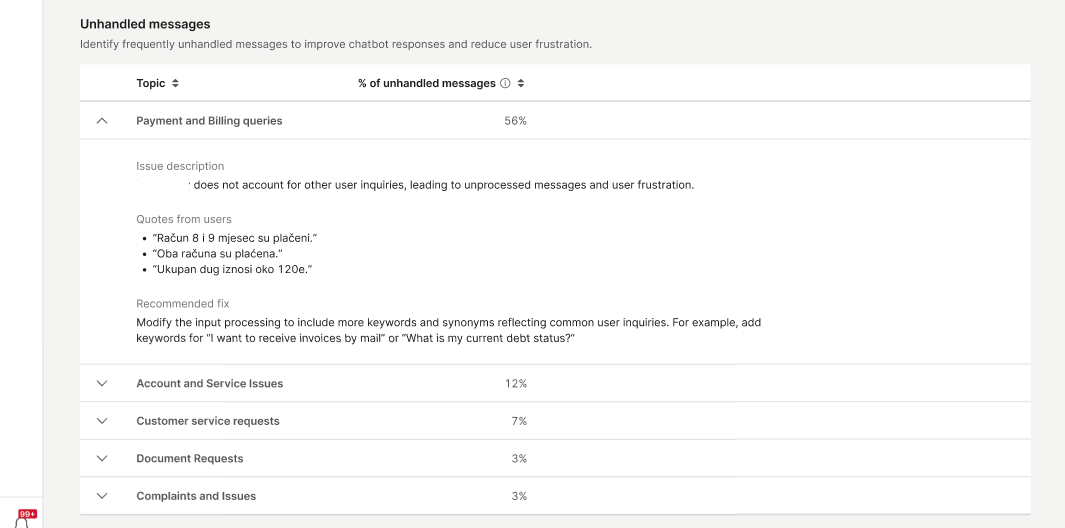
Unhandled messages [#report-content-unhandled-messages]
Go to the Detected issues > Unhandled messages section.
Unhandled messages are the end users' messages to which the chatbot did not respond, and end users' inputs that the chatbot did not recognize.
Some of the reasons for unhandled messages are as follows:
- End user did not know how to answer the chatbot's question.
- End user gave an invalid or incorrect response.
- The AI engine could not recognize the intent of the end user's message.
The table in this section shows the following information:
-
A list of topics that have unhandled messages.
A topic is an AI-generated grouping of similar unhandled user messages.
-
For each topic, the reason for unhandled messages, a sample of the messages from end users, and recommendations to resolve the issue, are mentioned.
-
The percentage of unhandled messages for a specific topic compared to the total number of unhandled messages in the chatbot.
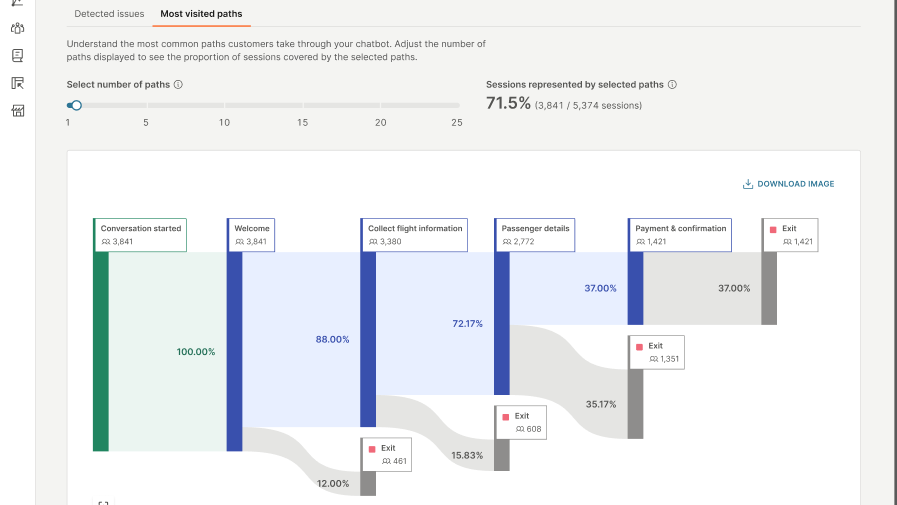
Most visited paths
View the most common paths that end users take during their sessions with your chatbot. See how many end users fail to complete these paths. Identify dialogs at which they drop off and improve those dialogs.
What is a path
A path is an end user's journey from the start of the chatbot session to its end. It shows the sequence of dialogs that the end user interacted with.
The path can vary depending on the following:
- The dialogs the end user enters.
- The options end users select within a menu or a decision point.
- The branching logic defined in the chatbot design.
Example: An end user reaches the Menu dialog, selects Product information, and is directed to the Products dialog. Another user selects FAQ in the Menu dialog and is directed to the FAQ dialog. Thus, the two users follow different paths.
Common path
A common path is the path taken by a majority of the end users.
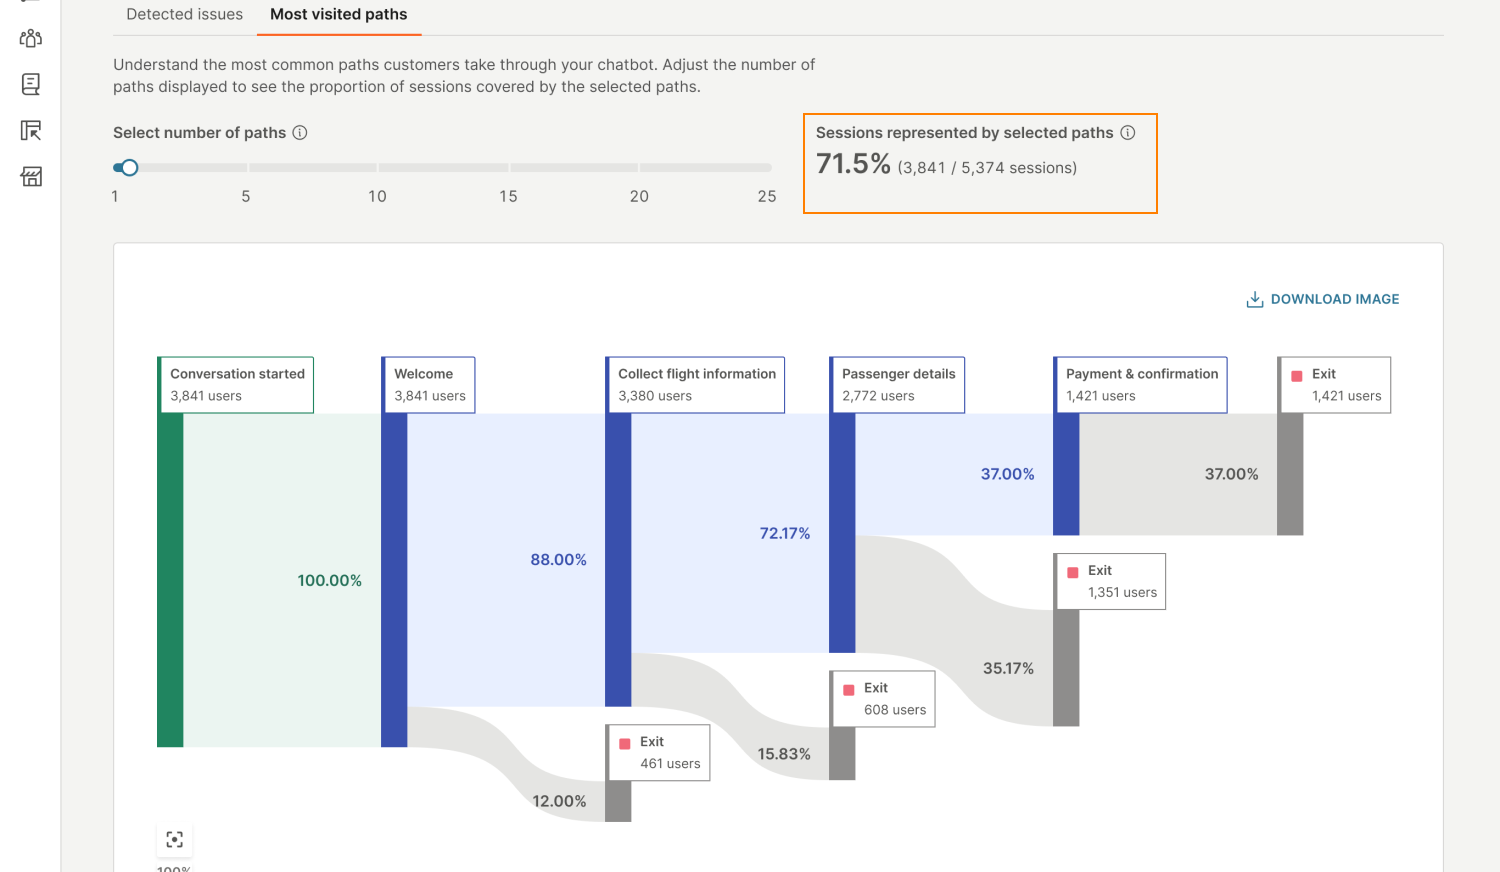
How to use the graphs
In the select number of paths field, select the number of common paths that you want to analyze. A graph is generated for each path.
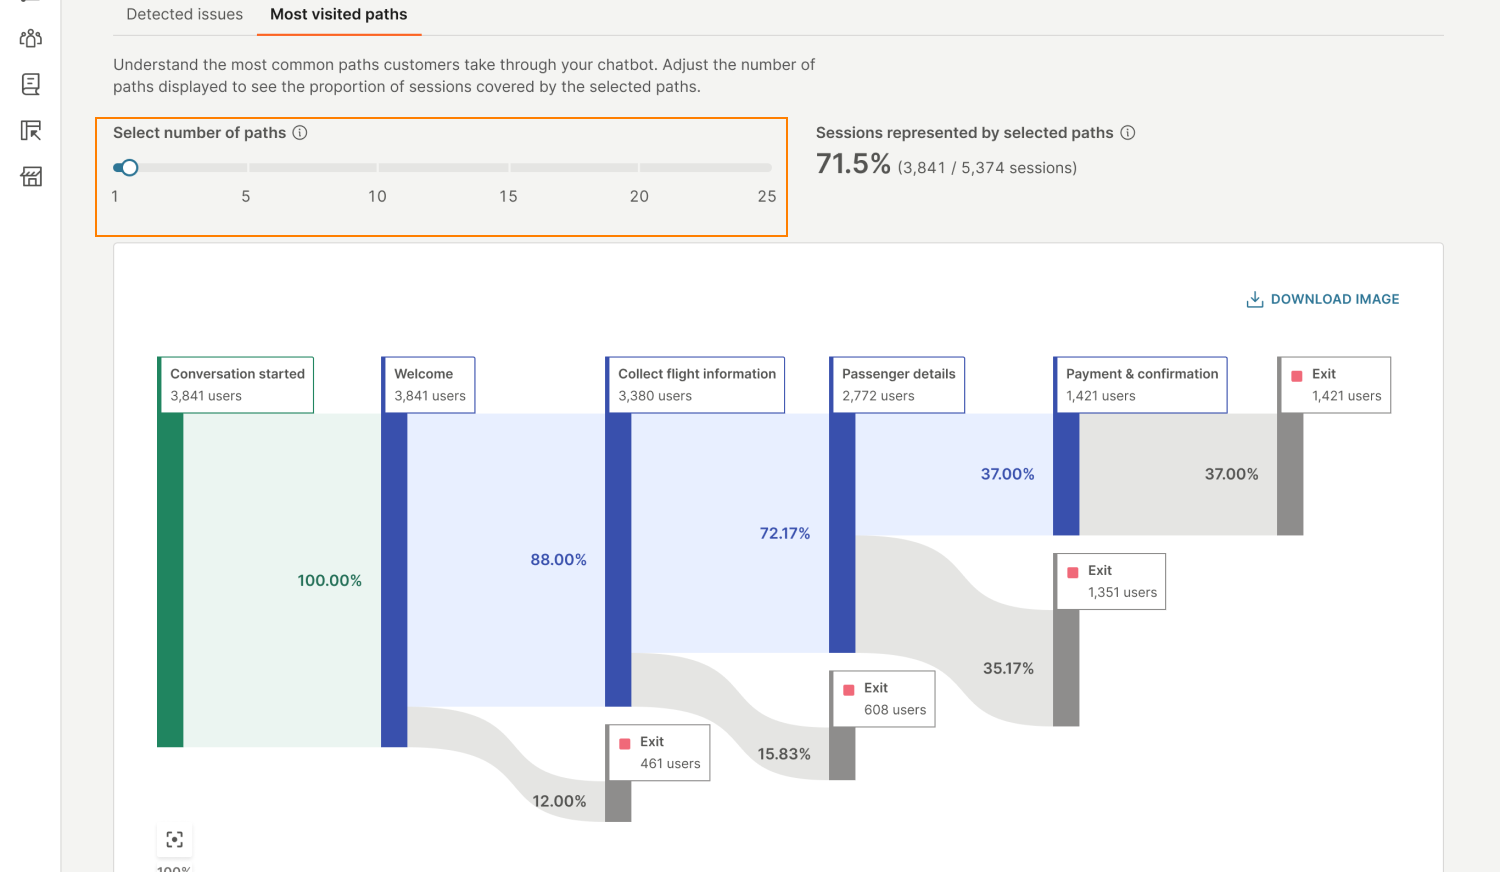
The data shows the number of sessions that these paths represent.
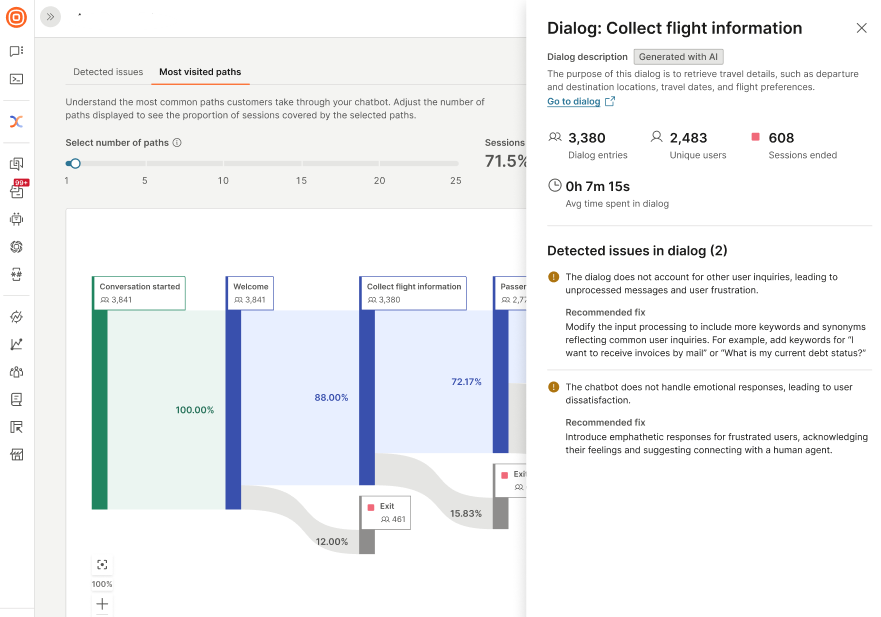
The following image shows the graph for a single path. It shows that in 71.5% of all chatbot sessions during the specified period, end users followed this path.
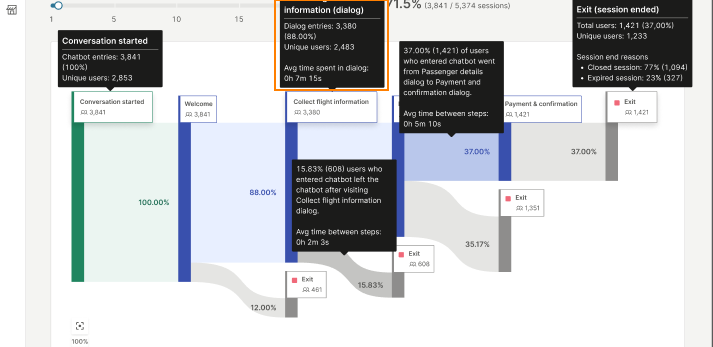
Hover over a dialog to see the information for that dialog. The data shows the number of end users who entered a dialog, the number of unique end users, and the average time they spent in the dialog.
If the average time in a dialog is higher than expected, consider simplifying the end user experience for that dialog or splitting the dialog into multiple dialogs.
You can see the number of end users who entered each dialog and the number of end users who dropped off at a dialog. Consider why end users could have dropped off.
The following graph shows that 3,841 end users started a chatbot session by sending an initial message to the chatbot and they all reached the Welcome dialog. But only 3,380 went to the next dialog in the path, Configure flight information, and the remaining dropped off.
The percentages show the following:
- Proportion of end users went from this dialog to the next, out of all end users who started a chatbot session.
- Proportion of end users dropped off at this dialog, out of all end users who started a chatbot session.
Select a dialog to view insights about that dialog. This data includes the following:
- Dialog description: The description that the AI engine generates based on the dialog content and the messages exchanged between the end user and the chatbot. The description contains the purpose and content of the dialog.
- Data about the end users' interaction with the dialog. This includes the number of end users who entered the dialog, the number of unique end users, the number of end users who exited the dialog, and the average time end users spent during their interaction with this dialog.
- Detected issues in the dialog: A list of issues that the AI engine identifies in the dialog and recommended solutions for each issue.